Insightful Accountant: Qvinci Previews Custom Charts & Graphs Builder
“When the Custom Charts and Graphs Builder is released, it will allow the user to custom design and build a wide variety of reporting packages including charts and graphs from their blended data and any user-defined financial, KPI and business intelligence reports.”
 William Murphy, Senior Editor, Insightful Accountant
[Originally Published in Insightful Accountant, November 7, 2018 – By William Murphy]
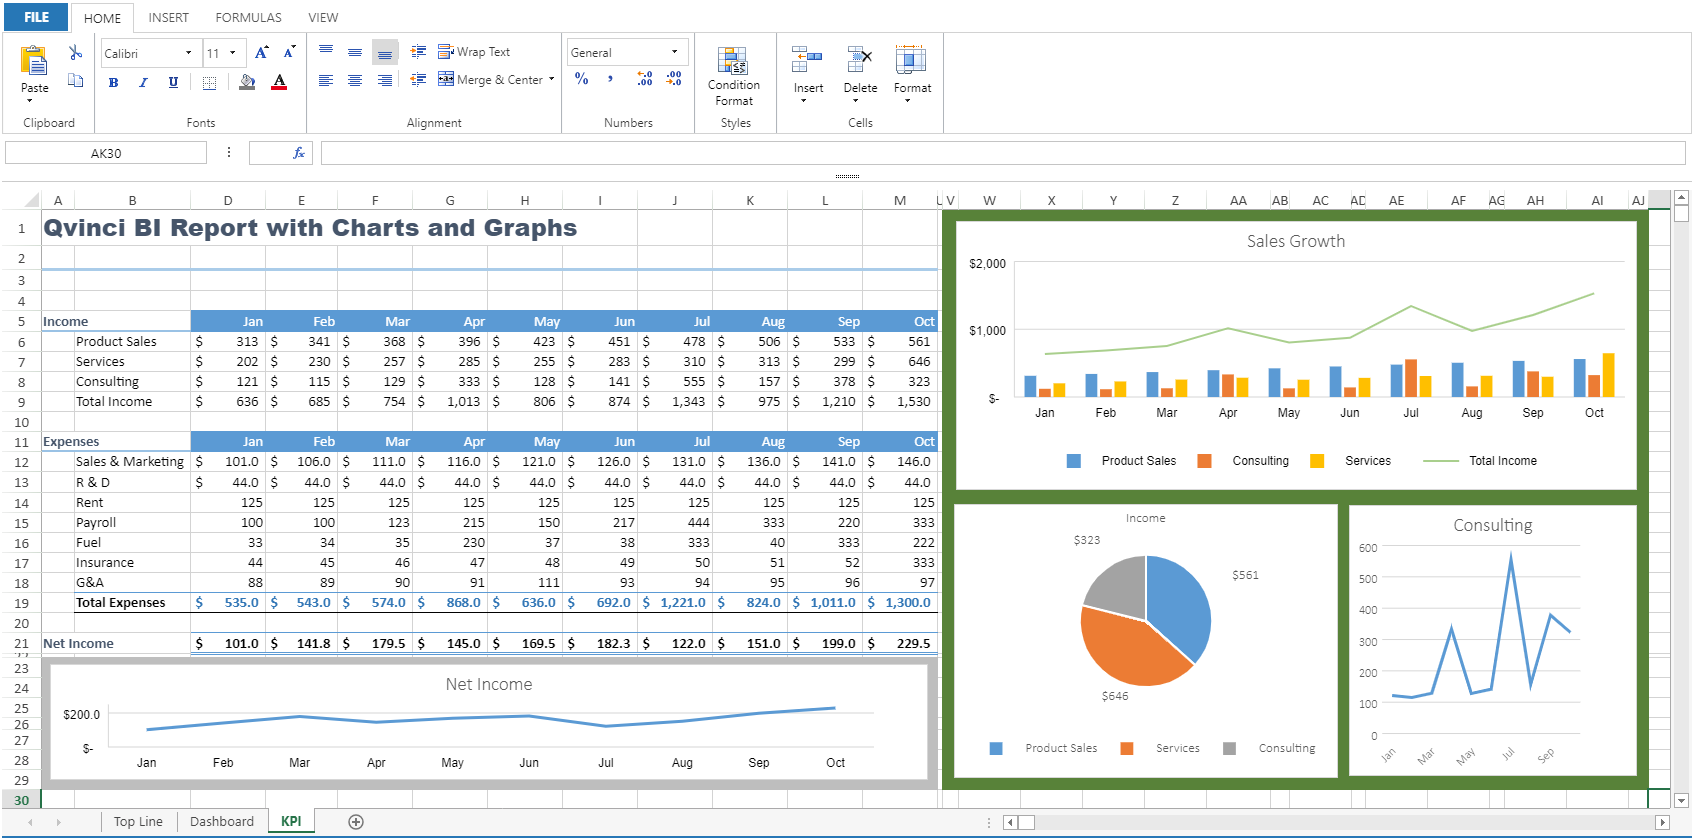
Just in time for reveal during QuickBooks Connect in San Jose (CA), Qvinci is giving those in attendance a ‘sneak peek’ at their new Custom Charts & Graphs Builder that allows users to easily custom design and build charts and graphs with their data from their Qvinci reports, key-performance-indicators and other business intelligence. And like Qvinci’s reports, once these custom charts and graphs are templated, they can be used forever without needing to recreate them each time the data is reported.
This new functionality is a continuation of the Dynamic Report Blending and Advanced Business Intelligence features Qvinci released a couple of months ago that allows a user to author, style, edit, package and publish sophisticated user-defined financial, KPI and business intelligence reports – blending data from multiple types (P&L, Balance Sheet, etc.) and other data sources (Excel) in one customizable templated package. Insightful Accountant’s App Aware (article) of that feature can be found here.
When the Custom Charts and Graphs Builder is released and added to the overall Qvinci reporting package capabilities, it will allow the user to custom design and build a wide variety of reporting packages including charts and graphs from their very blended data and any user-defined financial, KPI and business intelligence reports. Most importantly, when the data changes or is updated, the charts and graphs will automatically update too. The resulting reporting packages can include financials, Benchmarking, Peer Forecasting, Budget vs. Actual, and numerous analytical and forecasting results.
Outside a complicated and expensive ERP system (generally well above the reach of SMBs and their advisors), everything else on the market is either canned KPIs, boilerplate dashboards or one-size fits all charts and graphs. The new Qvinci feature is really a tool for the firm of the future!
But at this point I have to remind you that Qvinci is only ‘previewing’ this new feature at QuickBooks Connect, this isn’t an official ‘release announcement.’ Most likely, the ‘go-live’ date is somewhere between 30 and 60 days away. Still the same, if you want to find out more about the Custom Charts and Graphs Builder, the recently released Dynamic Report Blending and Advanced Business Intelligence or any Qvinci features, be sure to check out the Qvinci website.
Contact Qvinci:
John Logan
EVP of Sales and Marketing
Qvinci Software LLC
844-422-5037
Contact Insightful Accountant:
William Murphy
Senior Editor
Insightful Accountant, LLC