Live Webinar (FREE)
What’s the easy way to maximize your entire franchise organization’s collaboration, efficiency, and profitability?
The answer is simple: Technology that’s affordable, a breeze to implement, and provides actionable financial insights everyone understands. That’s how to get all locations and Operations on the same page and happily moving forward together.
And when that happens, everyone from the top down thrives!
What You’ll Learn at This FREE Webinar
STEP 1 – Get the Data
How patented technology that automates the process around collecting, consolidating, and mapping of financial data from unit-level Charts of Accounts to a Standard Chart of Accounts saves tons of time.
Say “goodbye” to hours upon hours of hands-on spreadsheet consolidation of disparate account names (i.e., “Expenses,” “Expenditures,” and “Costs”). Just ‘click’ a button and before you can get your next cup of coffee the entire process is completed for you. No more headache. No more missing data. No more inconsistent filing.
STEP 2 – Analyze the Data
When franchise Operations and owners utilize the same automated and customizable reporting and business intelligence tools that provide actionable financial insights everyone understands, the sky’s the limit for collaboration, efficiency, and profitability.
STEP 3 – Take Action!
Information is POWER… but it’s only as powerful as the ACTION you take to utilize it.
Your franchise must ensure that franchise Operations and franchise owners maximize communication and collaboration to develop a synergistic working relationship with the mutual goals of increased efficiency and profitability. Eliminate the “Big Brother” syndrome and cultivate a win-win mentality.
Live Webinar (FREE)
Introducing Qvinci’s New Features and Functionality Enhancements to Help Franchises Maximize Collaboration, Efficiency, and Profitability
(Thursdays @ 11:30 AM CT)
You’ll Also Learn…
- How implementing Qvinci’s ultra-effective “Push-Pull” dynamic of communication and collaboration is proven to generate a strong working relationship between franchise Operations and owners.
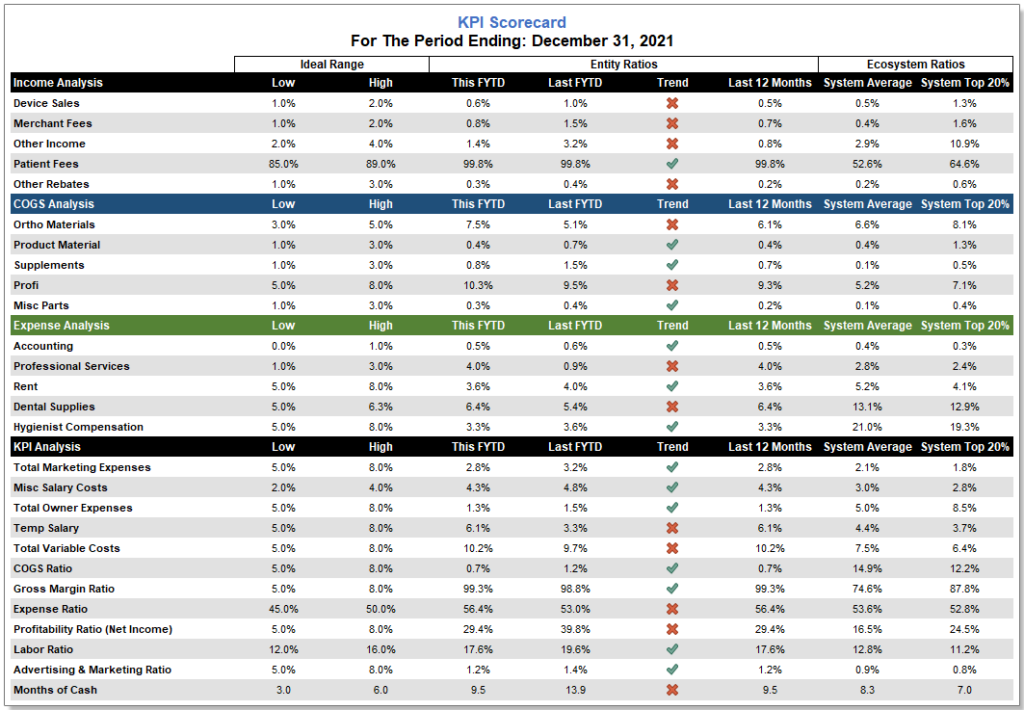
- Why color-coded data (GREEN = Favorable / RED = Unfavorable) translates into actionable financial insights everyone understands. GREEN means “You’re good” and RED means “Uh oh, we need to talk!”
- How utilizing benchmarking, trend analysis, KPI monitoring, and advanced drill-down capabilities significantly diminish the risk of critical decision-making while fueling growth and profitability.
- AND LOTS MORE….
Plus, New Advanced Drill-Down Capabilities
For Impactful Granular Data!
The Advisory Portal provides a single, wide-angle view of your franchise locations’ summary movement of data over time (dynamic), illustrates color-coded (GREEN = Favorable / RED = Unfavorable) trending across various time periods, and focuses on the 10 key ratios that drive most organizations (plus lots more).
Now, with four quick clicks of a mouse, users can easily drill through multiple layers of actionable data to further research relevant issues:
- Choose the desired reporting period and review the data directly in the Advisory Portal
- Click any desired cell and drill down to the Advisory Analysis Card to review more data
- Drill down even further into underlying financial reports for the next level of granular data
- Drill down to the most granular data at the transactional level in the General Ledger and Journal Entries
Qvinci’s New KPI Ratio and Scorecard Report Templates
These 9 newest reports are ultra-useful and packed with Key Performance Indicator data that provide tons of actionable insights that are quickly accessible, simple to read, and easy to implement. The new reports – KPI Ratios (click HERE for example), KPI Scorecard with Benchmarking (click HERE for example), and KPI Scorecard without Benchmarking (click HERE for example) are provided free to all Qvinci users for the following periods:
- Fiscal Year to Date vs Same Period Prior Year
- Reporting Month vs Prior Month
- Reporting 3 Months vs Prior 3 Months
Bonus: Create, Edit, Style, Package, and Publish Report Packages
Qvinci also provides 100+ gallery report templates in the Jumpstart Gallery that can be used by our customers free of charge as is or customized at will. With Qvinci, customers can also create, edit, style, package, and publish entire reporting packages, which include, among other things, business intelligence, financial reporting, cover pages, indexes, and disclosures, all designed to your exact specifications.
Examples
Single-Entity
Multi-Entity
(Click titles to download)
Live Webinar (FREE)
Introducing Qvinci’s New Features and Functionality Enhancements to Help Franchises Maximize Collaboration, Efficiency, and Profitability
(Thursdays @ 11:30 AM CT)
What Franchises Are Saying About Qvinci…
“Business Intelligence capabilities such as peer benchmarking have proven to be very valuable. For Example, before Qvinci, it would have taken me months to consolidate reports from 100 locations. Now, that work can be done in five minutes.”
— Brett Shraiar, Business Development Manager —
MaidPro
![]()
![]()
_