The great news is that Intuit has teamed up with Qvinci as a QuickBooks Solution Provider and industry leader in financial reporting and business intelligence that provides TONS more capabilities at a HUGE discount, and savvy Fathom users are switching over too.

It’s time to upgrade!

Qvinci’s Advisory Portal With Advanced Drill-Down
Capabilities Places Relevant Data at Your Fingertips

The acclaimed Advisory Portal provides a single, wide-angle view of your client’s or business unit’s summary movement data over time (dynamic), illustrates color-coded (GREEN = Favorable / RED = Unfavorable) trending across various time periods, and focuses on the 10 key ratios that drive most organizations (plus lots more).

Qvinci Software Advisory Portal

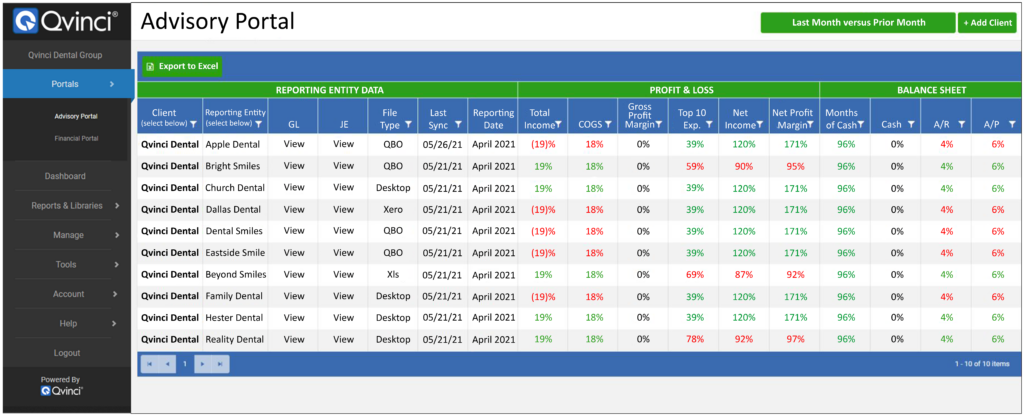
In sum, with Qvinci’s Advisory Portal and 4 quick clicks of a mouse, users can now…

  • Choose the desired reporting period and review the relevant data directly from the Advisory Portal 
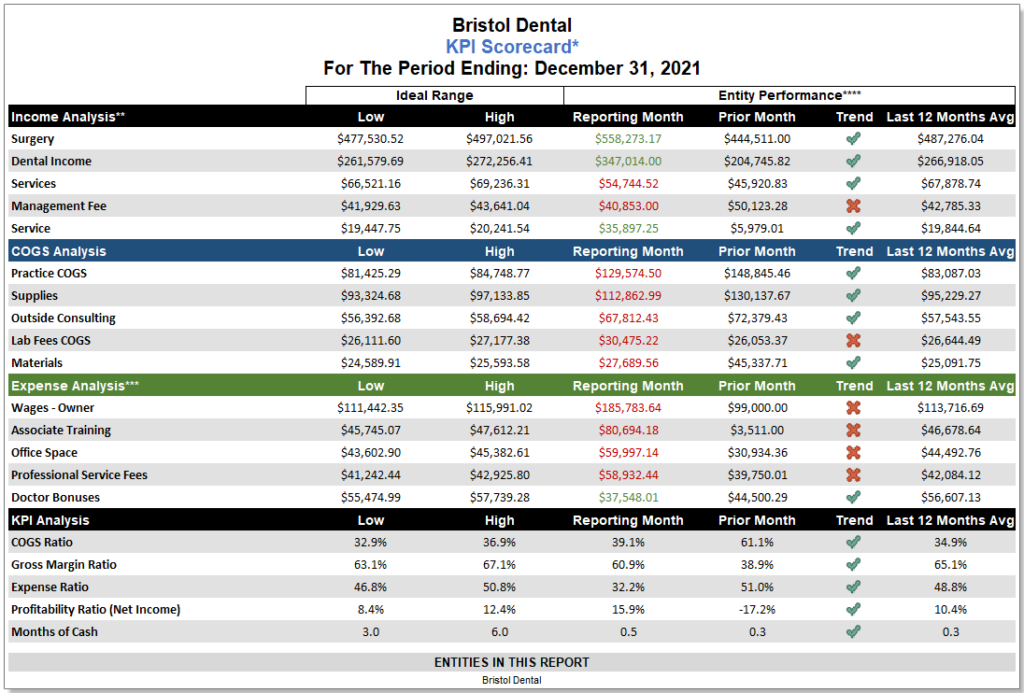
  • Click any desired cell and drill down to the Advisory Analysis Card to review more granular data 
  • Drill down even further into underlying financial reports for the next level of granular data 
  • Finally, drill down to the most granular data at the transactional level in the General Ledger

“Qvinci provides the Business Intelligence and Predictive Analytics needed to promote
advisory services in a big way. NOT JUST A SLOGAN, QVINCI DELIVERS!…
And the Customer Success Team Rocks!”
Molly Okerlund – President, Accountable to You, Inc.

Upgrade to automated and customizable reporting
and business intelligence and start saving money today!


Qvinci’s New KPI Ratio and Scorecard Templates
Simplify Actionable Insights

These 9 new reports are ultra-useful and packed with Key Performance Indicators that provide actionable insights that are quickly accessible, simple to read, and easy to implement – KPI Ratios (click HERE for example), KPI Scorecard with Benchmarking (click HERE for example), and KPI Scorecard without Benchmarking (click HERE for example) are provided free to all Qvinci users for the following periods:

  • Fiscal Year to Date vs Same Period Prior Year
  • Reporting Month vs Prior Month
  • Reporting 3 Months vs Prior 3 Months

COMPREHENSIVE AND ROBUST REPORTING PACKAGING

Qvinci also provides 100+ Jumpstart Gallery report templates that can be used as-is or customized per your specifications. With Qvinci, you can create, edit, style, package, and publish entire reporting packages that include business intelligence, financial reporting, cover pages, indexes, and disclosures. Simply ‘click’ to download or customize and style at will.

Examples
Single-Entity
Multi-Entity
(Click titles to download)


SPECIAL PRICING BONUS!

  • Already have QuickBooks? Add Qvinci and receive a 50% discount for the first 3 months*.
  • Need to purchase QuickBooks Online Advanced? Qvinci is included for FREE!
  • For all other QuickBooks solutions, contact us for discounted bundled pricing!

Upgrade to automated and customizable reporting
and business intelligence and start saving money today!


Included with Qvinci…

When you partner with Qvinci, you’ll get a simple user interface with next-level flexibility and customization that provides actionable financial insights everyone understands:

  • Near Real-Time Muti-Unit Data Collection, Consolidation, and Account Mapping (Qvinci’s Patented Technology) – Have multiple locations that use disparate account names (i.e., “Expenses,” “Costs,” and “Expenditures”)? Say goodbye to the hours-long headache of manually reconciling disparate account names from your various units. Qvinci’s patented technology automates the process of collecting and consolidating unit-level Chart of Accounts and mapping all that data directly to a Standard Chart of Accounts with the ‘click’ of a button.
  • Simple Color-Coded Financial Insights (GREEN = Favorable / RED = Unfavorable) – Qvinci solved the ages-old dilemma of most business owners not understanding traditional financials, nor being interested in learning to. When GREEN means “You’re good” and RED means, “Uh oh, we need to talk…,” any layperson can make clear sense of the actionable metrics in the Advisory Portal.
  • Key Performance Indicators – Understanding your past, grading your present, and predicting your future is now easier than ever. Use conditional formatting and custom KPIs based on your ecosystem metrics to analyze trended comparisons.
  • Benchmarking – Set your standard and measure how well your clients or units are measuring up. This way you can easily identify what top performers are doing right and get poor performers to start implementing best practices.
  • Cashflow and Financial Forecast Modeling – Use advanced Model Merge Technology to create a virtually unlimited number of What If scenarios to show the granular impact of potential decisions on future cashflow and financial positioning. A powerful tool for avoiding otherwise unforeseen catastrophes or simply navigating recessionary times.
  • 100+ Jumpstart Gallery Reports – Use as-is or customize to your specifications.
  • Report Editor – Excel-like but eliminates the spreadsheet chaos. If you can envision it in Excel, you can likely build it in Qvinci.
  • Expert Customer Success Team – Qvinci’s rockstar team of friendly experts is ready to help you every step of the way.

“Business Intelligence capabilities such as peer benchmarking have proven to be very
valuable. For example, before Qvinci, it would have taken me months to consolidate
reports from 100 locations. Now, that work can be done in five minutes.”
Brett Shraiar – Director of Operations, MaidPro

Upgrade to automated and customizable reporting
and business intelligence and start saving money today!

__
Learn About Qvinci in the QuickBooks App Store

_

* Intuit and QuickBooks are registered trademarks of Intuit Inc. Used with permission under the QuickBooks Solution Provider Program.